Visualize Your Communications Inventory in Full Context
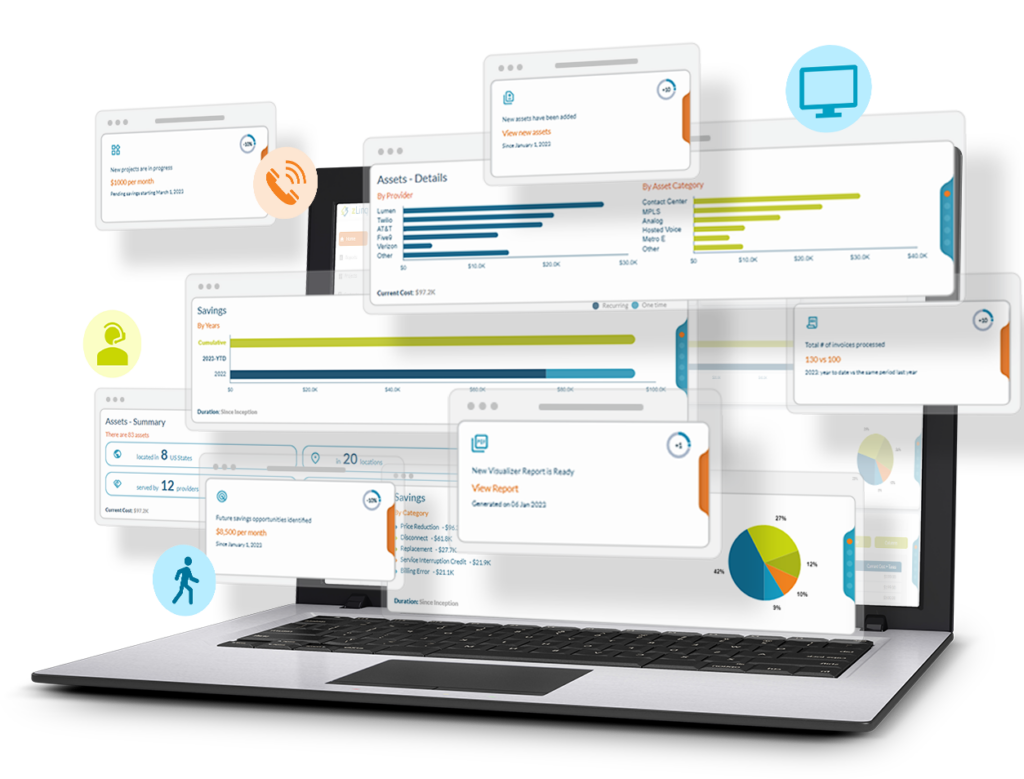
What if you could see your entire communications infrastructure in full context—of providers, locations, contracts, even down to individual circuit IDs?
The zLinq visualization toolkit is the only solution developed specifically for IT to collect, analyze, and decode your infrastructure data in near-real time.

Uncover Key Insights and Take Control of your Telecom Spend


Gain a clear view, keep teams focused, and execute with confidence—all backed by a partner committed to your success.
Our Visualization Toolkit gives you a real-time view of your infrastructure, empowering you to make quick, informed decisions.
We bring everyone together around top priorities with consulting and support that fosters collaboration, not competition.
As your partner, we take on the heavy lifting of change, sharing the risk and guaranteeing impactful results.

“Visualizer was such a refreshing way to understand our communications infrastructure, I literally felt my blood pressure go down. We also can’t thank you enough for the $45K credit you got us on UPN for fiber project upgrade, we would not have known to ask.”

IT Service Coordinator (42 Sites), Green State Credit Union - $137k saved to date
Discover Your Savings Potential
Millions Saved, Thousands of Hours Returned—The zLinq Effect.
FAQs
Find answers to common questions and learn how zLinq can simplify your telecom management.
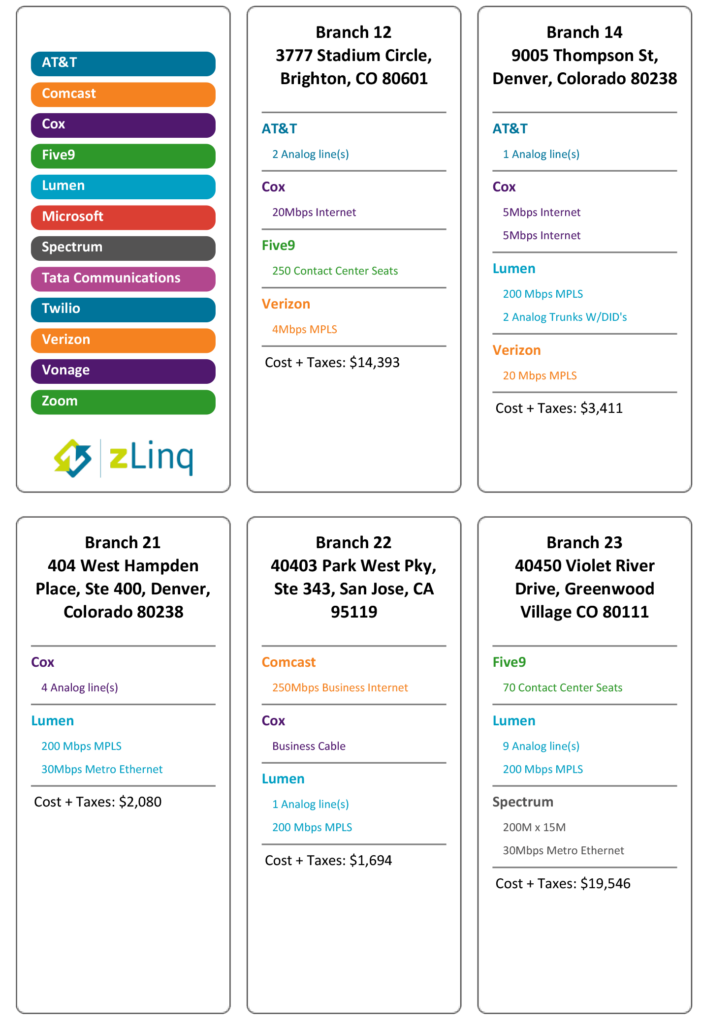
zLinq helps you visualize all your communications assets and costs with context and clarity. Ultimately, visualization untangles what you have, where you have it, and why you have it.
We uncover details by building a billed services inventory from invoices that provides granular visibility into your telecom infrastructure in our software, right down to the contract details and circuit ID, so together we can identify anomalies and find quick win savings.
The zLinq software builds a clean and crisp mapping of a company’s communications inventory on a site-by-site basis. For each site, details of each voice and data asset are diagrammed including elements such as an asset’s type, attributes, provider, contract expiration, and site-wide cost of services including taxes.
Laying out these details in this clean context allows you to see what you have where, all in a quick glance. It makes clear where anomalies exist and allows us to identify ways to help you clean up your infrastructure and find wasted spend.
Join our newsletter to stay up to date on features and releases.
By subscribing you agree to with our Privacy Policy and provide consent to receive updates from our company.
© 2025 zLinq. All rights reserved