zLinq helps customers own the success of their voice, data, contact center, and mobility investments by providing comprehensive visibility across their communications environment. Our Customer Dashboard is a real-time window into your environment, allowing you to manage costs, align priorities, and take decisive action.
The zLinq Advantage: Clarity, Alignment, and Impact
Gain a clear view, keep teams focused, and execute with confidence—all backed by a partner committed to your success.
See Your Telecom Environment Clearly
Our Visualization Toolkit gives you a real-time view of your infrastructure, empowering you to make quick, informed decisions.
Keep Teams Aligned and Focused
We bring everyone together around top priorities with consulting and support that fosters collaboration, not competition.
Execute with Confidence, Supported Every Step
As your partner, we take on the heavy lifting of change, sharing the risk and guaranteeing impactful results.
“zLinqgot to 644% of their savings guarantee for us. The engagement has gone extremely well, we constantly recommend you to other Credit Unions. We used an agent before and when they reached out a couple months back asking if zLinq is delivering, I told them emphatically ‘yes.’ ”
Kent Richards
CIO (37 Sites) Blue Federal Credit Union $343k saved to-date.
Cut Telecom Costs Without Cutting Corners
Ready to see how much you could save? Schedule a call with our experts and get a personalized telecom savings estimate—fast and easy.
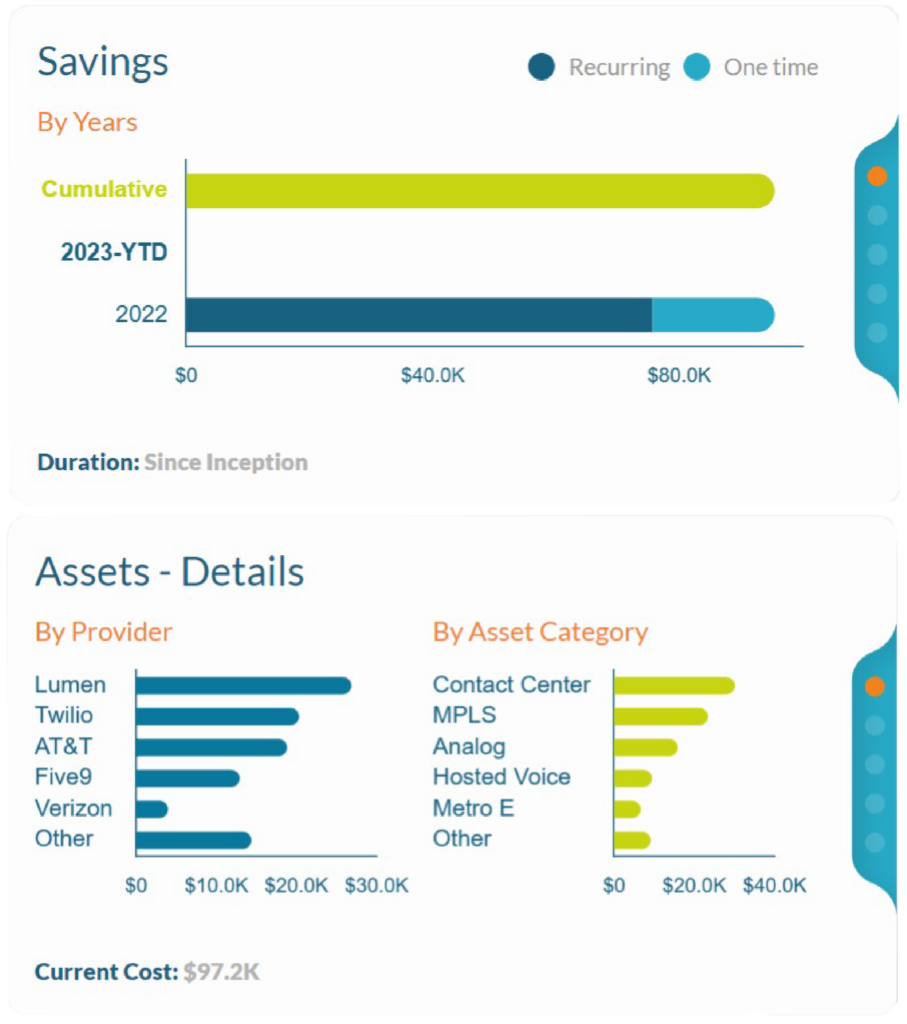
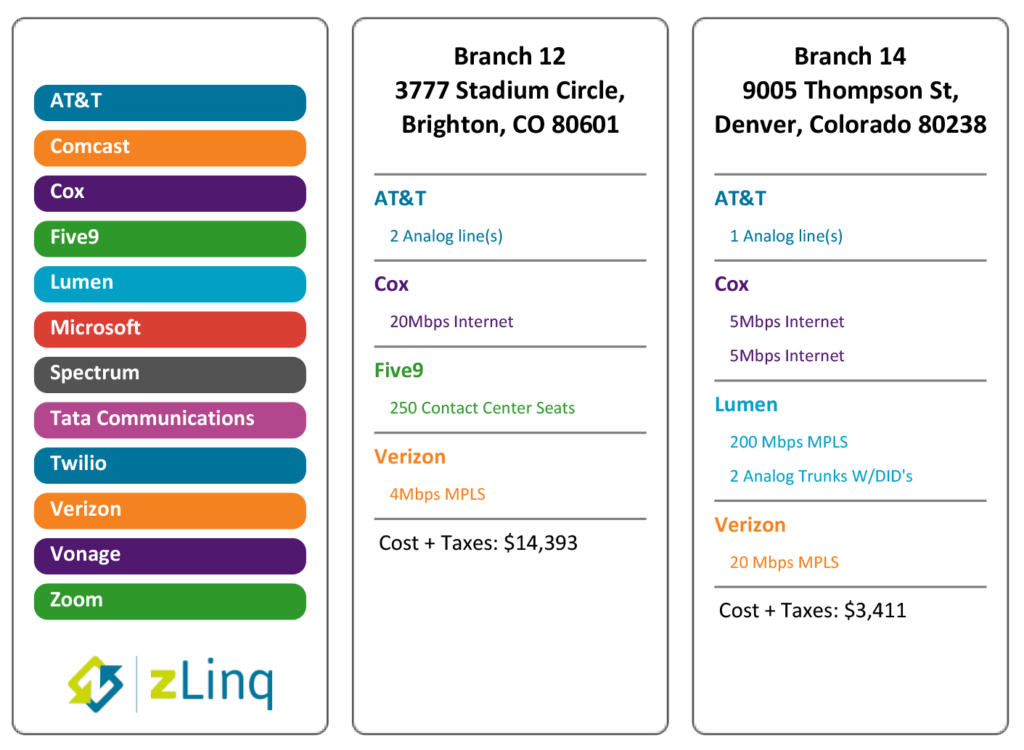
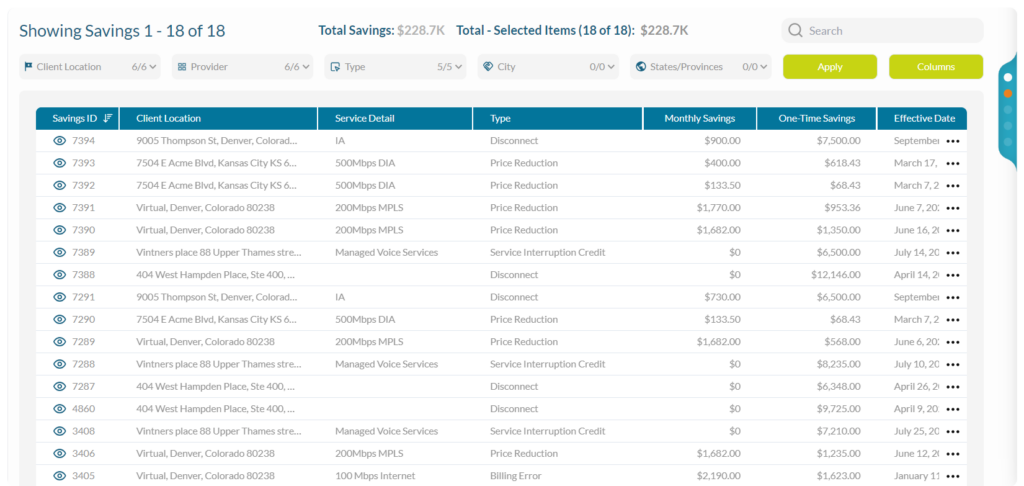
Once we build your inventory in the dashboard, you get real-time insight into your providers and assets across all of your locations. You also can view savings achieved by year and asset category, provider, and location. For example, often we find services still being billed at a site that was shut down years ago or pricing way above market rates based on our deep benchmarking database.
We use cookies to improve your experience on our site. By browsing our website, you consent to our use of cookies in accordance with our Privacy Policy.AcceptPrivacy policy